
Short answer
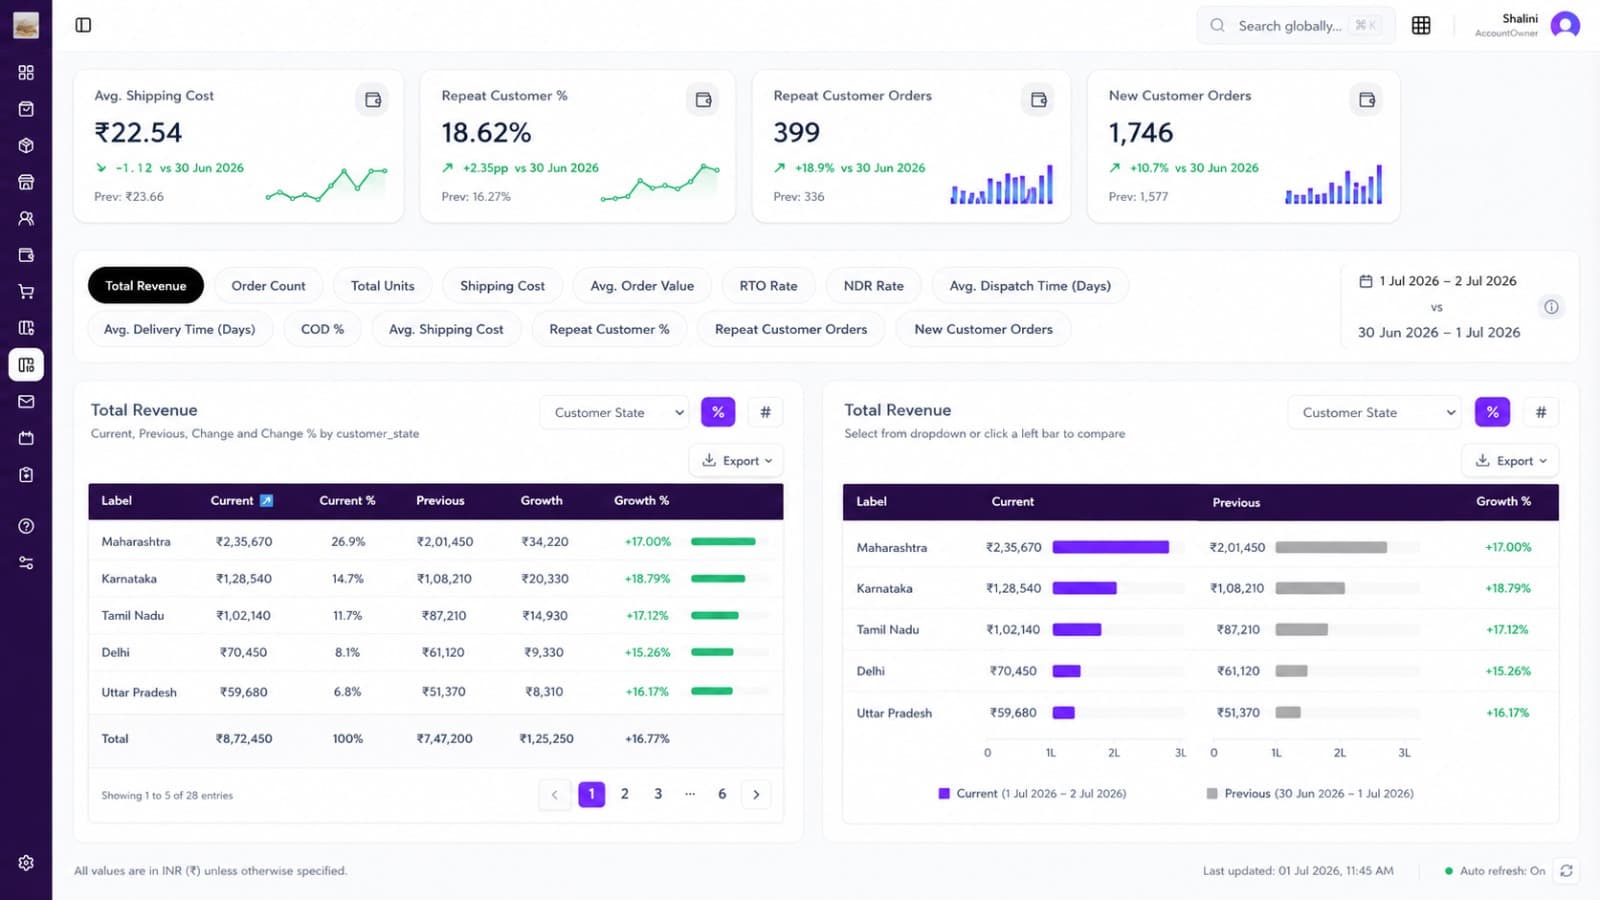
A Shopify, Shiprocket and Unicommerce dashboard joins store orders, shipment outcomes and inventory into one view. It should track orders and revenue by channel, order-to-dispatch time, delivery time and NDR by courier and state, RTO by payment mode, and days of cover by SKU, so operations problems show up before they hit revenue.
Key takeaways
- Join the three systems by order ID and SKU.
- Count revenue on delivered orders, or COD and RTO will inflate it.
- Courier and state cuts reveal most delivery problems.
- Add ad spend later to turn an ops dashboard into a profitability view.
Shopify knows what was ordered. Shiprocket knows what happened to the parcel. Unicommerce knows what's in stock and where. Each tool has its own reports, but the questions that matter need all three.
What each system contributes
| System | Key data |
|---|---|
| Shopify | Orders, line items, customers, payment mode, discounts, revenue |
| Shiprocket | AWB, courier, pickup and delivery dates, NDR events, RTO status, shipping cost |
| Unicommerce | Inventory by SKU and warehouse, multi-channel orders, fulfilment status |
Join on order ID (Shopify ↔ Shiprocket ↔ Unicommerce) and on SKU (Shopify ↔ Unicommerce).
The metrics to include
| Section | Metric | Why |
|---|---|---|
| Sales | Orders, gross and net revenue, AOV, by channel | The top line |
| Sales | Delivered revenue | Real revenue after RTO |
| Fulfilment | Order-to-dispatch time | Warehouse speed |
| Delivery | Average delivery time by courier and state | Courier performance |
| Delivery | First-attempt delivery %, NDR rate | Where deliveries fail |
| RTO | RTO % by payment mode, state, courier, SKU | The biggest controllable cost |
| Inventory | Stock and days of cover by SKU and warehouse | Avoid stock-outs |
| Inventory | Slow movers (90+ days of cover) | Cash tied up |
A sample layout
- 1
Top row: the morning list
What changed since yesterday: revenue, RTO, delays, low-stock SKUs.
- 2
Second row: sales
Orders, revenue, delivered revenue, AOV, by channel.
- 3
Third row: logistics
Delivery time and RTO by courier × state heatmap; NDR trend.
- 4
Fourth row: inventory
SKUs below reorder point, days of cover by warehouse.
- 5
Drill-downs
Order-level and shipment-level tables for export.
Building it
DIY: export or pull data from each tool's API into a sheet or warehouse, join it, and build charts in Looker Studio or Power BI. Budget for maintenance when APIs or fields change.
Out of the box: connect the three in a D2C analytics tool that already models them.
How MarQet BI helps
MarQet BI connects Shopify, Shiprocket and Unicommerce natively, blends them with ads and marketplaces, and lets you ask "why did RTO rise?" in plain language. Orders and shipments export when finance needs the rows.
Frequently asked questions
Can Shopify, Shiprocket and Unicommerce data be combined?
Yes. Join them on order ID and SKU, either in your own warehouse and BI tool, or with a D2C analytics tool like MarQet BI that connects all three natively.
What should a Shiprocket dashboard show?
Delivery time, first-attempt success, NDR rate and RTO rate by courier, state and payment mode, plus shipping cost per order.
What metrics should a Unicommerce dashboard include?
Stock and days of cover by SKU and warehouse, fulfilment status and time, channel-wise orders, and slow-moving inventory.

Written by
Ayush Singhal, Founder, MarQetAyush founded MarQet to give D2C founders one system for customer conversations, daily performance and quick-commerce shelf availability.