
Short answer
D2C analytics means measuring the full path from ad spend to delivered, profitable order across your store, ads, courier, OMS and marketplaces. The essentials are contribution margin per order, blended MER and ROAS, CAC, RTO rate, and days of cover per SKU. Track them together in one blended dashboard, because each one alone can mislead you.
Key takeaways
- Revenue is not the scoreboard. Contribution margin after ads, shipping and RTO is.
- Platform-reported ROAS overlaps across Meta and Google. Use blended MER as the reality check.
- In India, RTO and COD can erase the margin on a 'profitable' ad. Analytics must include delivery outcomes.
- Use a daily 'what changed' list and a weekly review instead of a giant dashboard nobody reads.
Most D2C founders don't lack data. They have Shopify reports, Meta Ads Manager, Google Ads, GA4, Shiprocket, Unicommerce, Amazon Seller Central and maybe Blinkit, each with its own numbers. What they lack is one answer to simple questions: did we make money yesterday, and what changed? This guide explains how to get there.
What makes D2C analytics different
D2C analytics is operational. It isn't enough to know revenue went up; you need to know whether the extra orders were profitable once ads, shipping, COD and returns are included, and whether you have the stock to keep going. In India, three things make this harder:
- COD and RTO: a large share of orders can be cash on delivery, and some come back undelivered (RTO). An order isn't revenue until it's delivered and paid.
- Many channels: website, Amazon, Flipkart, quick commerce, offline. Each reports differently.
- Fragmented tools: the courier, OMS, ads and store all hold part of the truth.
The metrics that matter
| Metric | Formula | Why it matters |
|---|---|---|
| [Contribution margin](/glossary/contribution-margin) | Net revenue − COGS − shipping − payment/COD − returns − ads | The real profit per order before fixed costs |
| [MER](/glossary/mer) | Total revenue ÷ total ad spend | Blended efficiency, immune to attribution overlap |
| [ROAS](/glossary/roas) | Attributed revenue ÷ campaign spend | Campaign-level optimisation |
| [CAC](/glossary/cac) | Ad and acquisition spend ÷ new customers | What a new customer costs |
| [AOV](/glossary/aov) | Revenue ÷ orders | Basket size, affects shipping economics |
| [RTO rate](/glossary/rto) | Returned-to-origin orders ÷ shipped orders | Hidden margin killer, especially COD |
| [LTV](/glossary/ltv) | Contribution margin per customer over time | How much you can afford to pay for CAC |
| [Days of cover](/glossary/days-of-cover) | Stock ÷ average daily sales | Whether growth will hit a stock-out |
Why you need blended data
Each platform tells a partial story. A revenue dip could be ad fatigue, a stock-out, a courier delay in one region or a checkout bug. Looking at one tool at a time, you'll find the wrong cause.
Campaign-level vs product-level analytics
Marketing teams think in campaigns; operations teams think in products. You need both: campaign-level to decide where to spend, product-level to decide what to push, make and stock. See campaign-level vs product-level analytics.
A reporting rhythm that works
| When | What | Who |
|---|---|---|
| Every morning | What changed overnight: revenue, spend, RTO, stock alerts | Founder, growth, ops |
| Monday | Weekly review: contribution margin, MER, CAC, RTO by courier and state, top SKUs | Leadership |
| Monthly | Cohorts, LTV, channel contribution, inventory planning | Founder, finance |
Building your stack
Options range from free (Shopify reports plus Looker Studio) to analyst-heavy (Power BI with a data warehouse) to purpose-built D2C tools. Our D2C analytics dashboard tools buyer's guide compares them.
How MarQet BI fits
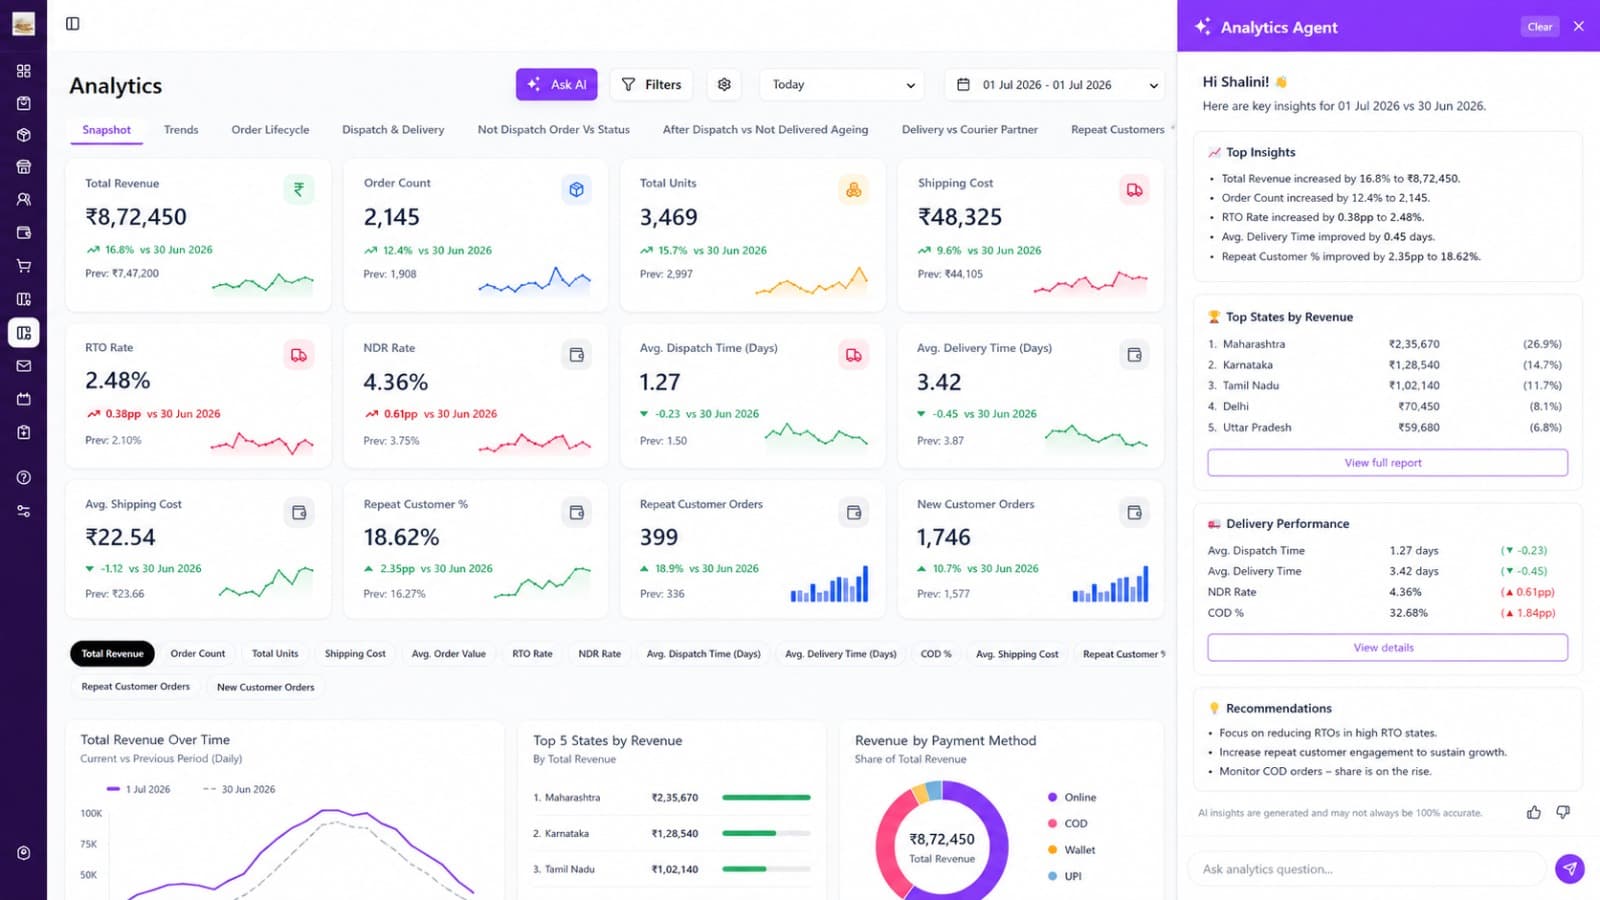
MarQet BI connects Shopify, Shiprocket, Unicommerce, Meta Ads, Google Ads, GA4, Search Console, Amazon Seller, Blinkit and telephony. Each morning it lists what changed (returns up, an ad wasting money, products running low on cover), lets you ask why a number moved in plain language, emails the report you'd otherwise rebuild every Monday, and exports the underlying orders and shipments when finance asks.
Campaign-level vs product-level, in one Monday
A fashion brand can see a campaign ROAS of 4.2x and still be losing money on the SKU the campaign sold — because that SKU has a 22% COD RTO. The campaign view says "scale". The product view says "stop or change the offer". Read both: campaign-level vs product-level analytics.
Worked MER example (illustrative)
| Meta | Store | ||
|---|---|---|---|
| Spend | ₹3.5 lakh | ₹1.5 lakh | — |
| Reported revenue | ₹14 lakh | ₹6 lakh | ₹16 lakh actual |
Platforms claimed ₹20 lakh. The store made ₹16 lakh. MER is 16 / 5 = 3.2x. Meta ROAS looks like 4.0x. Use the ROAS / MER / CAC calculator with your numbers. These figures are illustrative.
Questions this hub is built to answer
- "What is D2C analytics?" — this page.
- "Best D2C analytics dashboard tools" — the buyer's guide that already ranks in Search Console.
- "Campaign-level vs product-level analytics for a D2C fashion brand" — the dedicated guide.
- MER vs ROAS, contribution margin, blended dashboards — linked from the metrics table above.
If a number cannot change a decision this week, it does not belong on the morning list.
Frequently asked questions
What is D2C analytics?
D2C analytics is the practice of measuring a direct-to-consumer brand's performance across its store, ads, logistics, inventory and marketplaces, with the goal of profitable growth rather than revenue alone.
Which metrics should a D2C brand track?
Contribution margin per order, MER, ROAS by campaign, CAC, AOV, RTO rate, repeat rate and LTV, and days of cover for key SKUs.
What is the best analytics tool for D2C brands in India?
It depends on team and stack. Shopify reports and Looker Studio suit early brands; Power BI suits analyst-led teams; D2C-specific tools like MarQet BI blend Shopify, Shiprocket, Unicommerce, ads and marketplaces with AI summaries for lean teams.
Why do Meta and Google ROAS not add up to my Shopify revenue?
Each platform attributes conversions using its own model and window, so the same order can be claimed twice. Use blended MER (total revenue ÷ total ad spend) as the reality check.

Written by
Ayush Singhal, Founder, MarQetAyush founded MarQet to give D2C founders one system for customer conversations, daily performance and quick-commerce shelf availability.